Microscope resolution tests

A forum to ask questions, post setups, and generally discuss anything having to do with photomacrography and photomicroscopy.

Moderators: rjlittlefield, ChrisR, Chris S., Pau

Tardigrade37
Posts: 134
Joined: Tue Mar 04, 2008 7:38 pm

Microscope resolution tests

Post by Tardigrade37 »

I have been meaning to compare theoretical resolution to actual resolution in my microscopy setup, and a question from Charles Krebs regarding my low NA condenser prompted me to put this together. I have access to a resolution test slide prepared by a collaborative effort between researchers at the Marine Biological Laboratory in Woods Hole, MA and the National Nanofabrication Facility at Cornell in Ithica, NY that was made around 12 years ago. Unfortunately, these slides are no longer available for purchase, but most people can get by with the diatom test slides.

Abbe's formula for resolution = 1.22λ/(NAobj+NAcond)

My setup is as follows:

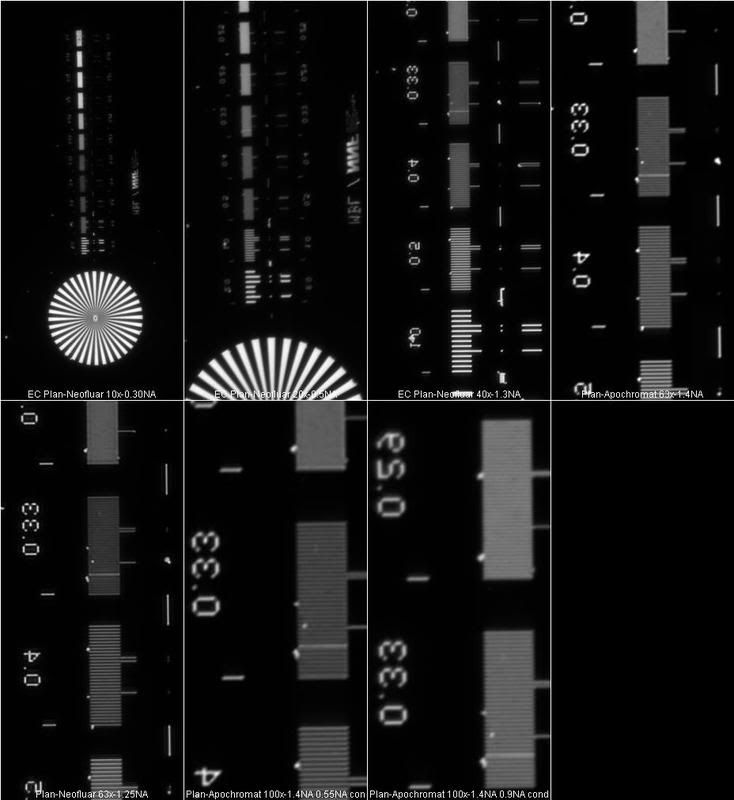
0.55 NA LWD condenser

EC Plan-Neofluar 10x/0.3 Ph1
EC Plan-Neofluar 20x/0.5 DIC
EC Plan-Neofluar 40x/1.3 oil Ph3 DIC
Plan-Neofluar 63x/1.25 oil Ph3
Plan-Apochromat 63x/1.4 oil DIC
Plan-Apochromat 100x/1.4 oil DIC

The images were acquired with a Hamamatsu ORCA-AG monochrome camera with CCD size 1344x1024. I used a green interference filter (roughly 550nm) for these tests and set up critical illumination for each objective. I will not go into details for the lower magnification objectives, but you can see the results in the first overview image.

Image

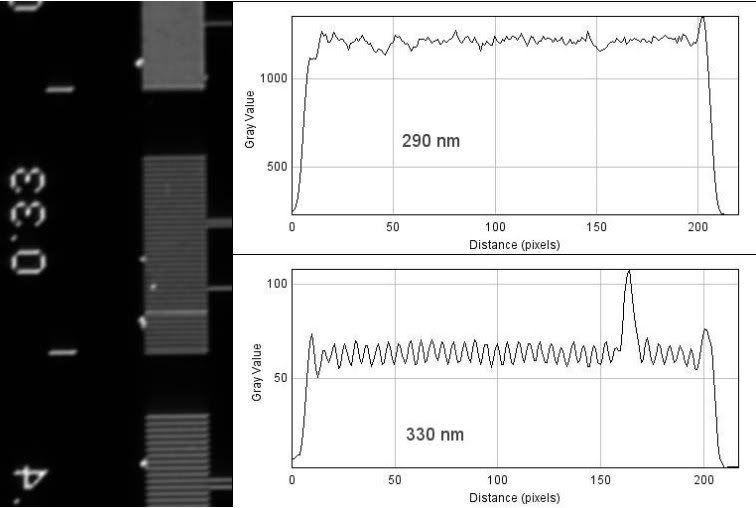
For 40x and above, I took a closer look at the contrast difference in the rulings. According to the Rayleigh criterion, an object is resolved if the contrast difference between points is 24% or greater.

The 40x 1.3NA EC Plan-Neofluar objective is a bit much for this camera and ideally, I should have 1254 vertical pixels to capture all of the resolution, so I am undersampling a tad. Nevertheless, I will include the results, but not the analysis...

Theoretical resolution:
(1.22*550nm)/(1.3+0.55)= 363nm
Image

The 63x 1.4NA Plan-Apochromat...
Theoretical resolution:
(1.22*550nm)/(1.4+0.55)= 344nm
Image

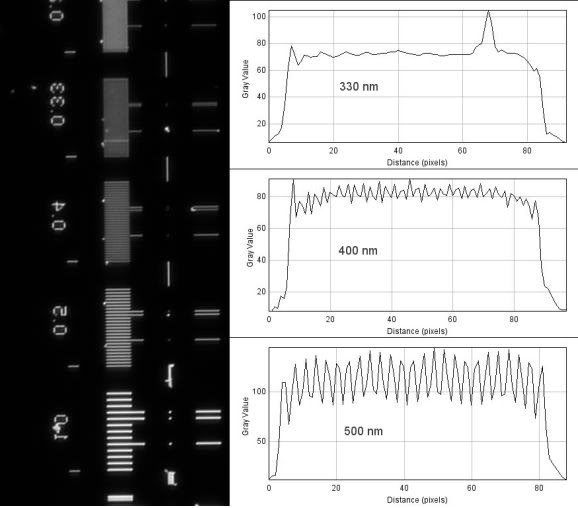
The 100x 1.4NA Plan-Apochromat...
Theoretical resolution:
(1.22*550nm)/(1.4+0.55)= 344nm
Image

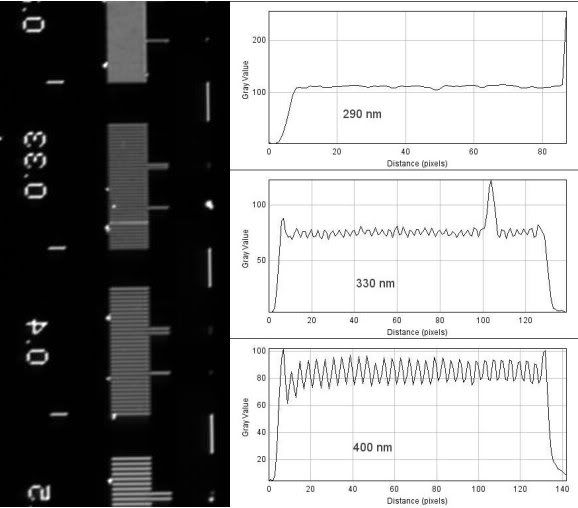
And finally, I used a 0.9NA condenser in place of the 0.55NA LWD to see what I might gain. Again, with the 100x 1.4NA Plan-Apochromat...
Theoretical resolution:
(1.22*550nm)/(1.4+0.9)= 292nm
Image

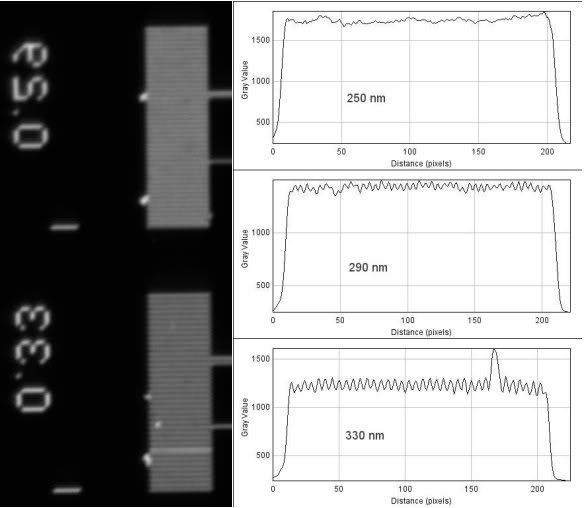
As you might be able to deduce from the line plots, seeing does not necessarily mean resolving according to the standard definition. With the 1.4NA objectives, I can resolve objects that are closer than 400nm, and although you can clearly see the rulings of 330nm, they are not fully resolved (only around 9-10% drop in intensity). With the 0.9NA condenser, you being to see clear periodicity in the 290nm rulings, but again, they are not fully resolved - I think part of this is due to a slightly out of focus image.

I have also taken images with the Nikon D70 DSLR as well, but I have not yet analyzed the results. It will be interesting to see how the interplay of a larger chip size and the RGB Bayer pattern influence the results. I will post back here when I've done this.

In the future, I hope to track down a 1.4NA condenser as well as a monochromator so I can demonstrate the influence of wavelength.

Chris

mgoodm3
Posts: 273
Joined: Mon Sep 08, 2008 8:50 am
Location: Southern OR

Post by mgoodm3 »

Got some serious resolution capabilities on the test slides there. the measurements in um/lp?

Charles Krebs
Posts: 5865
Joined: Tue Aug 01, 2006 8:02 pm
Location: Issaquah, WA USA
Contact:

Post by Charles Krebs »

Chris,

Very interesting. I'm going to spend some time looking this over. Thanks for posting it!

Were the Hamamatsu shots made with direct projection (relay mag of 1 )?
As you say, the Hamamatsu really needs a higher resolution for the 40X. My guess is the 400nm chart suffers because of this.


I'll be very curious to see the D70 results. Were they shot using any relay magnification? With the 2/3" sensor and direct projection you are recording a field number of about 11mm. To be comparing "apples to apples" you would want a relay a magnification of about 2.5X in order to record an 11.4mm field number on the DSLR.

One reason this would be interesting is that with the 40/1.30 as tested, the Hamamatsu is not even getting 2.5 pixels on the smallest resolvable detail, while the D70 (with 2.5X relay) would be putting about 4.5 pixels on that same detail. Advantage would go to the D70 in this regard. But... you are also dealing with a Bayer filter, anti-aliasing filter, and (depending on set-up) potential vibration.

Tardigrade37
Posts: 134
Joined: Tue Mar 04, 2008 7:38 pm

Post by Tardigrade37 »

Yes, the slide measurements are in um/lp - the extra rulings that far surpass light microscopy are there for checking the resolution of electron microscopes.

Charles, you're exactly correct, the Hamamatsu is connected via a 1.0x coupler and the D70 is coupled with a 2.5x relay lens. In retrospect, I also should have tested my Q-Imaging Micropublisher RTV 5.0 camera which has a chip size of 2580 × 1944 - I can use the same 1.0x coupler, or I also have a 0.63x relay that can be used on the front port. Again, this is a color camera and would have issues with the Bayer filter and so on.

The D70 does not have a mirror lock feature, so vibration will be present to some extent.

Charles Krebs
Posts: 5865
Joined: Tue Aug 01, 2006 8:02 pm
Location: Issaquah, WA USA
Contact:

Post by Charles Krebs »

he D70 does not have a mirror lock feature, so vibration will be present to some extent.
I had forgotten that. Based on the sampling rate I was ready to "guess :wink:" that the D70 would look a bit better with the 40X despite the Bayer filter and AA filter. Shutter vibration alone is an issue, but mirror vibration can be a real killer, especially when you are specifically scrutinizing fine detail (even though I realize you have a massive, heavy microscope). However, you never know until you try it. The shutter speed used can make a difference. It would also be interesting to do a comparison with between a shot make at about 1/60 second with another (where ND filters are put in place) taken with about a 3 second exposure.

We've all been told about, and seen examples of Bayer filter, AA filter negative effects (primarily by manufacturers of cameras that don't use them :wink:). But when you have at your disposal a monochrome 2/3" sensor camera that gets about 2 pixels on each detail, and a Bayer color camera that can sample at a much higher rate it would seem that at some point the higher sampling, coupled with good demosaicing would allow the color camera to equal and then surpass the monochrome. Unfortunately this would vary with subject color and detail. (Of course the scientific cameras, with their cooling, pixel shifting, tri-color exposures and other features are the best for many technical and science uses. I'm thinking more about use with subjects I typically work with where there is plenty of light and color is important.)

rjlittlefield
Site Admin
Posts: 23597
Joined: Tue Aug 01, 2006 8:34 am
Location: Richland, Washington State, USA
Contact:

Post by rjlittlefield »

Chris, this is really fine work -- thanks for the research & the posting!

I'll take this opportunity to post a couple of references that I've found very helpful in understanding resolution from the standpoint of MTF.

First off, there seem to be some differences in how to predict and measure contrast. According to http://www.normankoren.com/Tutorials/MTF1A.html, "MTF at the Rayleigh limit is about 9%", but also that that's "somewhat conservative because the Rayleigh limit is based on a spot, which has lower resolution than a band." The same number, 9%, is given HERE, and it's consistent with the curves shown below. I'm not sure how this relates to the "contrast difference" of 24% that you've listed.

At any rate, about the references...

This first one is from "Fundamentals of Remote Sensing" by George Joseph, the edited excerpt shown here taken from Google Books.

Image

In the above graph, the "Normalized spatial frequency" is calculated such that MTF = 0.0 even with perfect optics. This is the "cutoff frequency" (see page 151 of the book).

The second reference is http://www.bobatkins.com/photography/te ... ution.html, which notes in part that:
How close to zero the MTF must drop depends on a number of things such as the brightness of the image and the nature of the target pattern, but 1% (0.01) isn't an unreasonable value for a bright image and a high contrast bar pattern.

Putting these two together makes a couple of points clear:

1) If you're willing to see rulings at 1% MTF, then maximum resolution is improved, compared to a higher threshold. Compared to 9% MTF, it's about 25% better.

2) MTF drops completely to 0 (cutoff) just a little ways beyond MTF=1%. The MTF curve does not drop slowly toward zero with a long tail.

As I measure them, the finest visible rulings shown in your last panel have CTF around 3% at 290 nm, in the case where Abbe's formula gives 292 nm. This is somewhat less contrast than predicted by the formula, but it's certainly in the right ballpark.

There's one very interesting thing I see in your last panels. Comparing the 0.9NA condenser against the 0.55NA, it's clear that 290 nm is resolved with the 0.9 and not with the 0.55. On the other hand, contrast at 330 nm is actually reduced by about 30%. I know the usual rule of thumb says that you get best resolution by opening the condenser as far as possible, but that stopping down a bit gives better contrast. I wonder if your last two panels are a good illustration of that idea?

--Rik

PS. It's maybe not relevant to the current discussion, but http://www.bobatkins.com/photography/te ... ution.html also has a nice discussion of why ultimate resolution doesn't necessarily tell you how a lens performs for lower resolution detail. Fascinating stuff...

Tardigrade37
Posts: 134
Joined: Tue Mar 04, 2008 7:38 pm

Post by Tardigrade37 »

Spectacular addition Rik! It will take me a bit to fully digest everything you have written. Thanks for citing your references - I will try and track down the 24% I *thought* was attributed to Rayleigh. 9% sounds better to me as I've been scratching my head trying to figure out where I'm losing resolution. I may check the green interference filter in the spectrophotometer tomorrow to find out exactly what the bandpass is.

Charles Krebs
Posts: 5865
Joined: Tue Aug 01, 2006 8:02 pm
Location: Issaquah, WA USA
Contact:

Post by Charles Krebs »


Tardigrade37
Posts: 134
Joined: Tue Mar 04, 2008 7:38 pm

Post by Tardigrade37 »

Charles Krebs wrote:Chris, see figure 4.3, on page 60:

http://books.google.com/books?id=E2maxd ... t#PPA59,M1
Aha! Thanks Charles!

rjlittlefield
Site Admin
Posts: 23597
Joined: Tue Aug 01, 2006 8:34 am
Location: Richland, Washington State, USA
Contact:

Post by rjlittlefield »

Charlie, thanks for the reference.

It's going to take me a while to slog through the math, but I think I see the problem.

The picture drawn in Figure 4.11 of your reference does show a max/min ratio corresponding to 25% contrast, corresponding with their words.

But that picture corresponds to a source image consisting of two point sources that concentrate all their energy into zero-width regions. This assumption produces the highest contrast possible.

If you drew the same type of picture corresponding to a source image that was a sine wave of intensity, then the max/min ratio would be a lot smaller, something more like, um, 9%, I suspect.

And if you drew it for a source image that was a square wave of intensity, like Chris's target, it would be larger by a factor of 4/pi, about 11.5%.

It's interesting to note that any one of these numbers can make sense to use, depending on the application. If you're doing fluorescence microscopy and trying to separate emitters that are individually very small, then 25% contrast at Rayleigh spacing is the proper number. If you're looking at a smoothly striated structure in brightfield, 9% would be right. And if you're looking at a fabricated square wave target, it's 11.5%.

At least that's what I think right now...

--Rik

PS. For the record, this page at microscopyu has a nice formula for computing MTF as a function of spatial frequency. A similar formula appears HERE, in a tutorial from U.Arizona. But "similar" does not mean identical --- the microscopyu formula is missing a factor of 1/pi and as a result produces MTF's in the range of 0 to pi instead of 0 to 1. Sigh... Putting the missing factor back in, and evaluating the formula at Rayleigh frequency = cutoff/1.22 gives MTF = 8.94%. Both documents indicate that their source images are sine waves. Somehow I find this a satisfying result.

f = 0..1 frequency, as a fraction of cutoff
phi = acos(f)
MTF = 2/pi * (phi - cos(phi)*sin(phi))

11/13/2021, edited to add: The formula at microscopyu now includes the missing factor of 1/pi, and the tutorial from U.Arizona is now missing and was never captured by the Internet Archive. The formulas that I've quoted in this thread have stood the test of time.

Charles Krebs
Posts: 5865
Joined: Tue Aug 01, 2006 8:02 pm
Location: Issaquah, WA USA
Contact:

Post by Charles Krebs »

Like Chis, I know I have seen that 24-25% figure (numerous times), but I don't delve into this stuff as deeply as you guys... hurts my head :wink:

Actually, the 7 or 8 pages after the chart I referenced above is good reading as well.

Another interesting book that even discusses this with reference to the nifty MBL-NNF target that Chris used is here:

http://books.google.com/books?id=-hU_Wj ... A1-PA36,M1

rjlittlefield
Site Admin
Posts: 23597
Joined: Tue Aug 01, 2006 8:34 am
Location: Richland, Washington State, USA
Contact:

Post by rjlittlefield »

This whole discussion about MTF reminds me of what a colleague used to say: "Almost everything you read is true about something. The challenge is to figure out what that something is!"

These papers and web sites are frustrating because they're riddled with minor inconsistencies and glitches in the formulas. The conclusions are qualitatively correct, but the details don't work out. The first link that Charles provides says on page 60 "composed of alternating black and white bars", but then proceeds with an analysis that's implicitly based on point sources. Microscopyu leaves out a factor of 1/pi. And so on. There's enough information distributed around these sources to make sense of everything, but only with great effort, a lot of background, and hefty loads of both skepticism and persistence. Oh well, I guess it staves off Alzheimer's. :?

--Rik

Charles Krebs
Posts: 5865
Joined: Tue Aug 01, 2006 8:02 pm
Location: Issaquah, WA USA
Contact:

Post by Charles Krebs »

.... or makes you think you are already losing some cognitive capabilities... :smt017

Post Reply Previous topicNext topic